
Move freight forward with confidence
Your team already knows how to run a reliable operation. IntelliTrans gives them the clarity, tools, and support to do it with greater confidence and control.


The right supply chain dashboards transform raw transportation data into tools your team can act on immediately. For bulk and break-bulk shippers managing rail, truck, and multimodal freight, five dashboards form the foundation: real-time shipment visibility, fleet and asset utilization, operational efficiency and dwell time, carrier performance scorecards, and freight spend analytics. Together, they help transportation teams spot problems early, identify cost-saving opportunities, and make faster, more confident decisions.
Your transportation management system collects thousands of data points every day from railcars, trucks, carriers, and facilities across your network. But if that data sits in reports no one has time to read, you are not managing your supply chain; you are just documenting it.
The difference between data and insight comes down to presentation. Supply chain dashboards transform raw information into visual tools that help transportation teams spot problems, identify opportunities, and make faster decisions. For bulk and break-bulk shippers managing rail, truck, and multimodal freight, the right dashboards turn complexity into clarity.
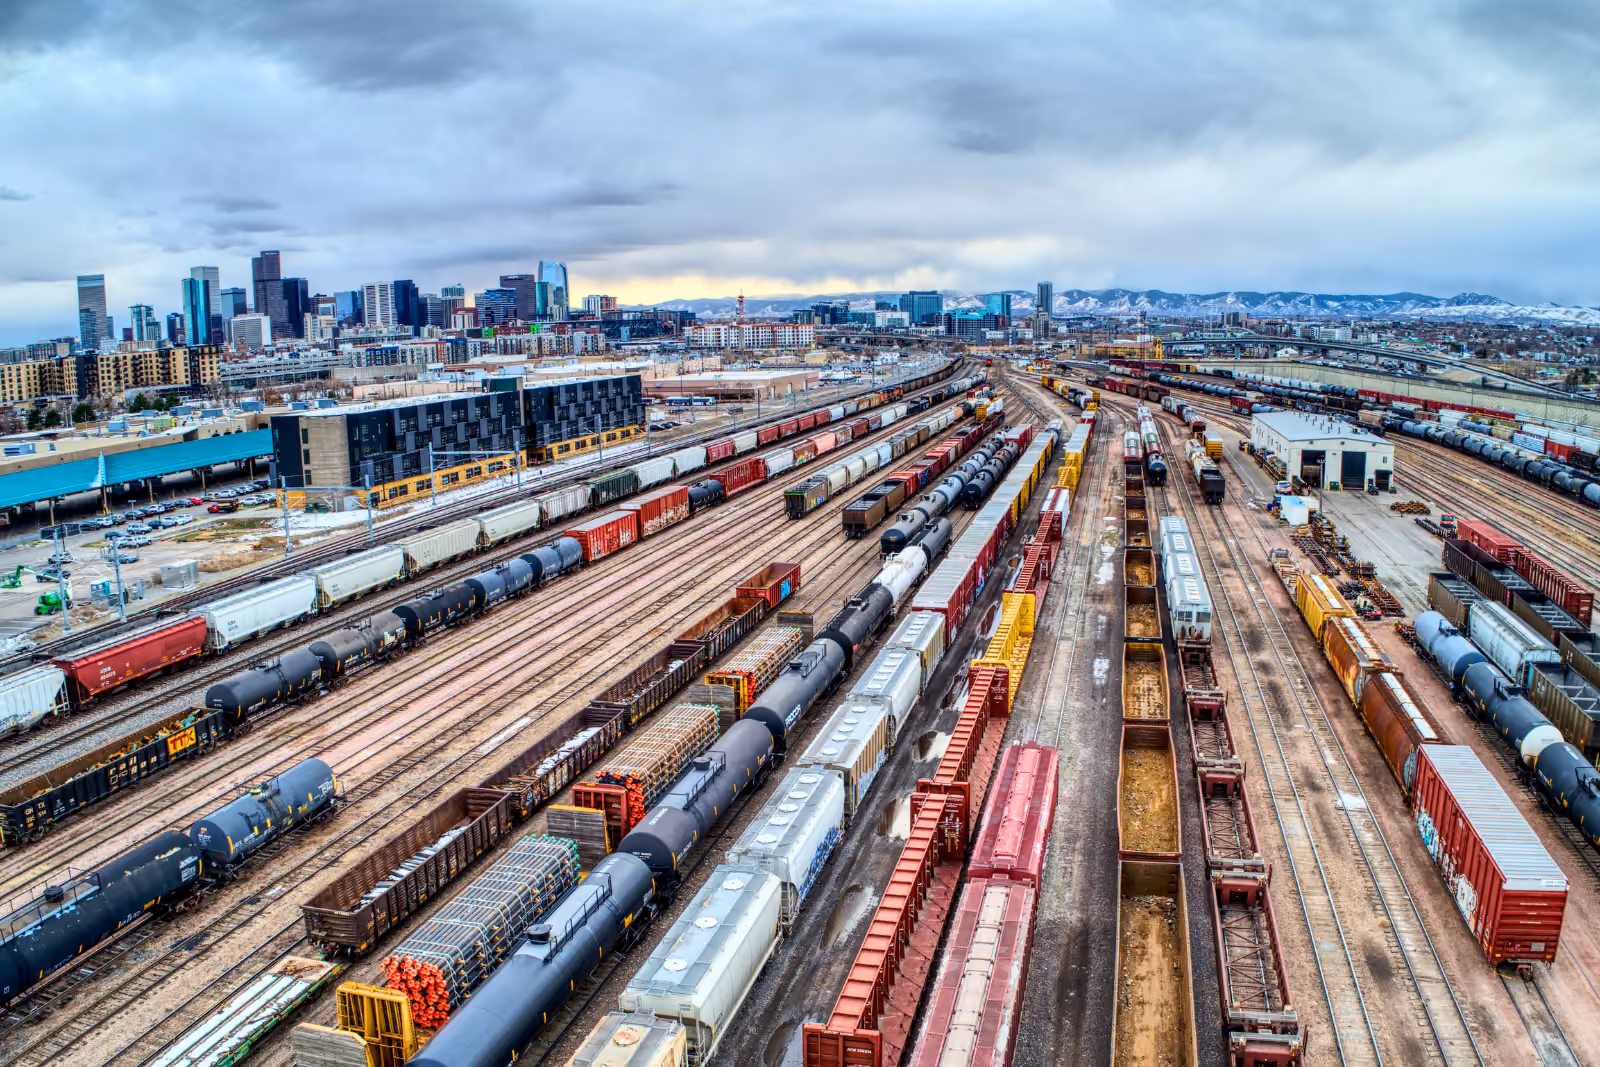
Bulk and break-bulk shippers face operational complexity that parcel and package carriers simply do not encounter. Managing railcar fleets across multiple railroads, coordinating truck shipments of hazardous materials, and tracking multimodal movements of commodities such as chemicals, aggregates, or metals requires visibility that generic reporting tools cannot provide.
The challenge is not a lack of information. Your rail tracking system generates car location messages from every railroad your equipment touches. GPS devices report positions continuously. Carriers send status updates. ERP systems track orders and inventory. The problem is synthesizing all of this into something useful.
Supply chain dashboards solve this by presenting the right information at the right time in formats designed for decision-making. Instead of scrolling through spreadsheets or waiting for weekly reports, transportation teams see what matters now and can act on it immediately.
Dashboards are not just about technology; they are about helping people do their jobs better. When your teams can see real-time shipment visibility at a glance, they spend less time chasing updates and more time solving problems. When carrier performance data is clear and accessible, conversations with carriers become productive rather than defensive.
The best supply chain dashboards reduce daily frustration, minimize manual data compilation, and give transportation professionals the confidence that comes from knowing what is actually happening across their operations.
The foundation of any transportation management system reporting capability is knowing where your freight is right now. For bulk shippers managing rail and truck operations, this means unified visibility across modes, carriers, and geographies.
A real-time visibility dashboard displays active shipments with current locations, status, and dynamic ETAs that update based on actual conditions. For rail operations, this includes car location messages showing which railroad currently has your equipment, terminal status, and any holds or delays. For truck freight, it shows GPS positions, delivery progress, and exception alerts.
The key is integration. Your rail tracking system data, truck GPS feeds, and carrier status updates all flow into a single view, eliminating the need for teams to check multiple systems. A chemical shipper can track tank cars across three railroads and coordinate truck deliveries from terminals in one place.
Before visibility dashboards, teams spent hours each day tracking down shipment status through phone calls, emails, and carrier websites. Now they can see what needs attention immediately. More importantly, they can proactively communicate arrival times to customers rather than waiting for customers to ask.
When a rail shipment is delayed at an interchange, the dashboard flags it before your customer calls to ask where their railcar is. This shift from reactive to proactive changes the quality of customer relationships and reduces the stress of constant firefighting.
For shippers with private railcar fleets, equipment represents millions of dollars in capital. A fleet utilization dashboard helps you maximize that investment by tracking how effectively your assets are working.
This dashboard shows cycle times (how long it takes for a railcar to complete a full trip from origin through destination and back), dwell times at various points, and overall utilization rates. You can see which cars are moving, which are sitting at customer facilities, which are in maintenance, and which have been idle longer than expected.
The metrics matter because idle equipment costs money. A railcar sitting at a terminal for extra days is not generating revenue and may be accruing demurrage charges. Fleet dashboards help you spot these situations before small delays become expensive problems.
Modern rail TMS capabilities also integrate lease management, showing when leases are expiring and helping you make informed decisions about renewals, returns, and fleet-sizing adjustments.
Beyond daily operations, fleet dashboards support strategic decisions. If your average cycle time has increased over the past quarter, you can investigate why. If certain lanes consistently show longer dwell times, you can address the root cause. If utilization rates suggest you have more cars than you need, you can make data-driven decisions about fleet size.
For transportation teams, this means fewer surprises and better planning. Instead of discovering at year-end that fleet costs exceeded budget, you can track trends monthly and adjust course early.
Dwell time (the time equipment spends waiting at facilities for loading, unloading, or processing) is one of the highest controllable costs in bulk freight operations. An operational efficiency dashboard makes these costs visible and actionable.
This dashboard tracks dwell times at origin facilities, destination facilities, and intermediate points like terminals and interchanges. For rail operations, it shows how long cars wait for placement, how long loading or unloading takes, and how long before cars get released back to the railroad. For truck operations, it tracks detention at pickup and delivery locations.
The value comes from pattern recognition. If a particular customer facility consistently holds railcars beyond the free time allowance, you can see the trend and address it before demurrage charges accumulate. If your own loading dock creates bottlenecks that delay outbound shipments, the data shows where to focus improvement efforts.
Dwell dashboards support multiple types of decisions. Operationally, they help teams prioritize which cars need the most urgent attention. Financially, they support demurrage accruals so there are no surprises when invoices arrive. Strategically, they provide data for conversations with customers or facilities about process improvements.
For transportation teams, this means fewer billing disputes and more productive relationships. When you can show a customer exactly how long their receiving process takes compared to similar facilities, the conversation shifts from blame to problem-solving.
You cannot improve carrier performance without measuring it consistently. Carrier scorecard dashboards track the metrics that matter and present them in ways that support better decisions.
Carrier scorecards typically track on-time pickup and delivery performance, tender acceptance rates, invoice accuracy, and service quality indicators. For rail operations, this might include transit time consistency and interchange performance. For truck operations, it covers load acceptance, appointment compliance, and documentation accuracy.
The key is to focus on KPIs that actually drive your business outcomes. A carrier with slightly higher rates but significantly better on-time performance might save you money overall by reducing customer complaints and inventory buffer requirements.
Supply chain analytics tools automate scorecard maintenance. Instead of manually compiling performance data, your transportation management software continuously tracks metrics and updates scorecards in real time.
Scorecards are not just for identifying poor performers. They are equally valuable for recognizing carriers who consistently deliver excellent service. When you can show a carrier objective data about their performance, contract negotiations become more productive. When you can demonstrate that you track performance fairly and consistently, carriers view you as a more desirable customer.
For transportation teams, scorecards replace gut feelings with data. Instead of debating whether Carrier A is really better than Carrier B, you can look at the numbers and make informed decisions.
Learn how control towers provide the visibility foundation for these dashboards in Using Supply Chain Control Towers to Minimize Miles Driven.
Understanding your true freight costs requires visibility across modes, carriers, lanes, and charge types. A freight spend dashboard consolidates this information and helps identify opportunities to optimize transportation costs.
This dashboard shows total freight spend broken down by mode (rail, truck, intermodal), carrier, lane, customer, and product. It tracks cost trends over time and highlights variances from budget or historical norms. For bulk shippers, it also tracks accessorial charges such as demurrage, detention, fuel surcharges, and switching fees, which can significantly impact total costs.
The visibility matters because freight costs are often fragmented across different systems and invoices. A freight cost management dashboard brings everything together so you can see the full picture rather than managing costs in silos.
Beyond visibility, cost dashboards support action. When you notice demurrage charges trending upward, you can drill down to understand why and address the root cause. If a particular lane consistently shows costs higher than expected, you can evaluate alternatives. If one carrier's accessorial charges are significantly higher than others, you have data to support a conversation.
For transportation teams, this means faster month-end close accruals, fewer invoice disputes, and a clearer demonstration of cost-savings initiatives. When leadership asks what transportation is doing to control costs, you have data to show, not just stories to tell.
Start with your biggest pain points. If your teams spend hours tracking down shipment updates, prioritize real-time visibility. If demurrage charges are eating into margins, focus on dwell time tracking. Most organizations find that real-time visibility provides the foundation for other dashboards.
Yes. Modern transportation management software integrates data from rail carriers, truck carriers, GPS devices, ERP systems, and other sources into unified dashboards. The key is having a platform that automatically handles data normalization so you do not have to manually reconcile information across different formats.
It depends on the dashboard's purpose. Real-time visibility dashboards should update continuously or near-continuously. Carrier performance scorecards might update daily or weekly, since trends matter more than minute-by-minute changes. Cost dashboards typically refresh daily as invoice data comes in.
Rail tracking involves longer transit times, multiple railroad handoffs, and data sources such as car location messages and interchange records. Rail dashboards need to account for terminal dwell, bad order repairs, and equipment cycles that truck dashboards do not address. The metrics also differ: railcar cycle time and fleet utilization matter more than individual delivery windows.
Dashboards provide proactive visibility into equipment dwell time, alerting teams when railcars or trailers approach free time limits. Instead of discovering demurrage charges on invoices weeks later, teams can spot developing problems in real time and take action.
Supply chain dashboards transform how transportation teams operate. Instead of spending mornings compiling data from multiple sources, your teams can start each day knowing exactly where to focus. Instead of reacting to problems after they have already cost money, they can intervene early and prevent issues from escalating.
The five dashboards covered here (real-time visibility, fleet utilization, operational efficiency, carrier performance, and freight spend) work together to provide comprehensive visibility across bulk freight operations. Each addresses a specific set of decisions, and together they create the foundation for proactive supply chain management.
For transportation professionals managing rail, truck, and multimodal freight, the right dashboards mean less frustration, fewer surprises, and more time for the strategic work that actually improves operations. The data is already there. Supply chain dashboards simply help you use it.
Ready to see how these dashboards can work for your operation? Connect with an IntelliTrans TMS expert to explore the analytics capabilities that matter most for your business.