
Move freight forward with confidence
Your team already knows how to run a reliable operation. IntelliTrans gives them the clarity, tools, and support to do it with greater confidence and control.


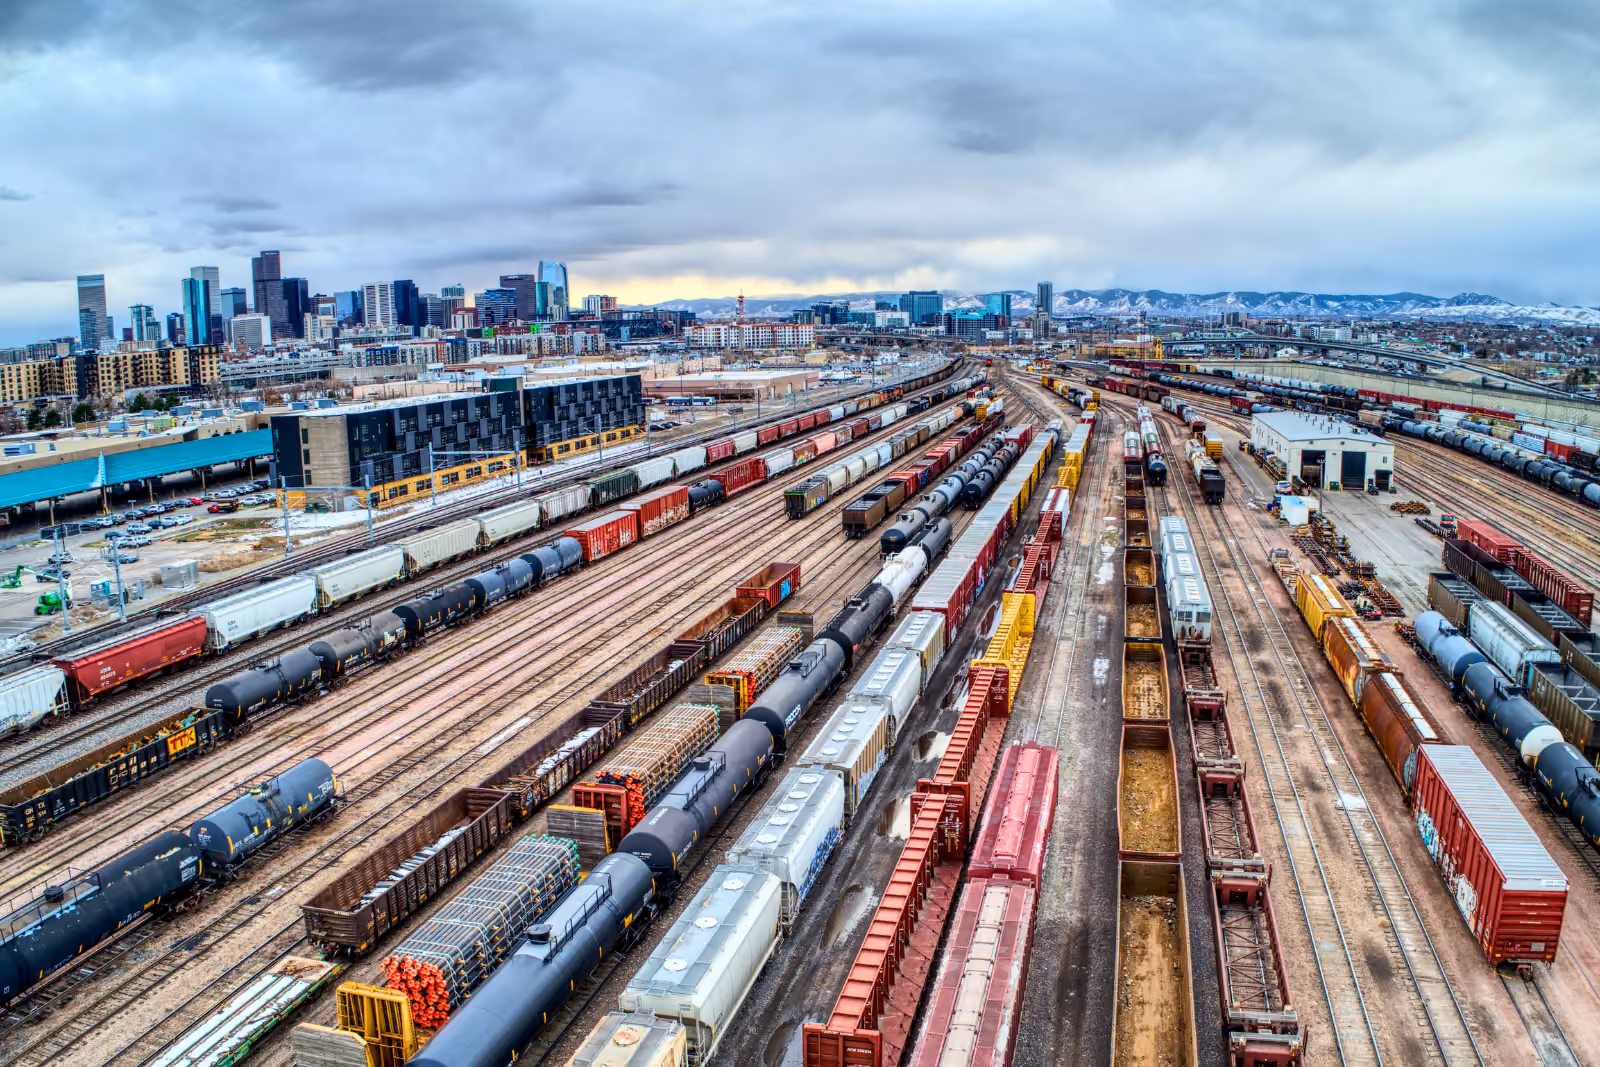
Multimodal visibility gives bulk and break-bulk shippers a single, connected view of orders, shipments, and equipment across rail, truck, barge, and intermodal operations. Instead of jumping between carrier portals, spreadsheets, and emails, transportation teams see where freight is, what is late, and what needs attention now, all in one place. This unified view helps teams plan with real data instead of assumptions, coordinate handoffs between modes, and catch delays before they become service failures or unexpected charges.
For shippers moving chemicals, aggregates, metals, or agricultural products, the stakes are high. A railcar that does not arrive when expected, a truck stuck at a congested terminal, or a missed transload window can ripple through production schedules, customer commitments, and freight costs. The more modes you manage, the harder it becomes to see what is really happening across the network.
Let's explore what multimodal visibility really means for bulk shippers, how it improves planning, and where it helps reduce the surprises that drive cost, stress, and risk.
Multimodal visibility is the ability to see orders, shipments, and equipment across all the modes you use (rail, truck, intermodal, barge, and more) in a single, connected view.
For a typical bulk shipper, that means pulling together:
Instead of living in separate systems and email threads, this information is normalized and presented through a single visibility and analytics layer. Transportation teams can see the full trip, from plant to customer, regardless of how many modes, carriers, or handoffs are involved.
Planning problems often begin with incomplete or delayed visibility. When teams cannot see what is happening across rail and truck moves in one place, they are forced to plan around assumptions and averages.
Common challenges include:
The result is a planning process that is more art than science. Teams add buffer days, build in extra inventory, and prepare for expediting because they do not trust the information available.
Multimodal visibility gives planners a grounded starting point: a unified operational view of where freight is, how it is moving, and what is likely to arrive when.
When rail, truck, and terminal data come together, planning stops being a static exercise and becomes an ongoing, data-driven process.
With multimodal visibility, planners can see not just how many shipments are scheduled, but where equipment actually is and how long it typically takes to cycle.
Instead of relying only on timetable assumptions, planners can forecast capacity using expected railcar returns based on live movement data, upcoming truck availability informed by current loads and ETAs, and cycle time trends that show whether lanes are speeding up or slowing down.
This visibility supports more confident decisions about how many cars to position, how much truck capacity to secure, and when to schedule high-priority orders.
For many bulk shippers, the riskiest parts of the journey are the handoffs: from rail to truck at a transload facility, from barge to warehouse, or from plant to terminal.
Multimodal visibility brings those handoffs into view. Teams can see when inbound railcars are due at a terminal and when outbound trucks are scheduled to pick up, which railcars are already spotted and ready to unload (and which are still en route), and how current yard congestion might affect loading, unloading, and dispatch times.
With this information in one place, planners can align schedules across modes. They can adjust truck appointments when railcars are delayed, or resequence unloading to protect the most time-sensitive orders.
Production and transportation planning often drift apart when they do not share the same picture of what is in transit.
With multimodal visibility, planners can see decision-useful ETAs for inbound raw materials and adjust production runs accordingly, understand in-transit finished goods by customer, product, and mode, and use lane-level performance and variability data to set more realistic reorder points and safety stock levels.
Instead of treating transportation as a separate, downstream function, visibility pulls it into the same planning conversation as production and inventory. That alignment helps prevent both stockouts and excess inventory while keeping freight flowing.
Better planning is powerful, but the real test comes when the unexpected happens. Weather, network disruptions, customer changes, and equipment issues will always create volatility. The question is how early you see those issues and how quickly you can respond.
Multimodal visibility helps reduce surprises in three key ways.
When visibility is limited, the first sign of a problem is often a phone call from a customer asking, "Where is my shipment?"
With multimodal visibility, exception alerts surface issues before they become crises: railcars dwelling at an intermediate yard longer than normal, trucks falling behind schedule due to traffic or weather, and missed interchange events that put a lane at risk.
Instead of searching for basic status updates, teams can focus on what to do next (rerouting a truck, resequencing loads, or coordinating with a customer on a revised plan).
Surprise demurrage and detention invoices are often worsened by poor visibility. If no one sees how long equipment has been sitting at plants, customer sites, or terminals, charges accumulate quietly.
Multimodal visibility platforms track dwell time across modes and locations. Transportation teams can monitor how long railcars or trailers have been at specific facilities, receive alerts as equipment approaches free-time limits, and prioritize moves that will prevent the next set of charges.
Over time, this visibility does more than prevent one-off surprises. It reveals patterns by lane, customer, and facility, helping teams focus process improvements where they will have the most impact.
Customers do not expect perfection, but they do expect transparency. When your teams have a unified view of orders and shipments across modes, customer conversations change.
Instead of saying, "We are checking with the carrier," account teams can explain where the shipment is now, what is causing the delay, and what options exist to protect the customer's operations.
This proactive communication reduces last-minute expediting, protects customer relationships, and demonstrates that you are managing the network, not just reacting to it.
Visibility only delivers value when it is translated into tools that busy teams actually use. For most bulk shippers, that means a combination of dashboards and exception-based alerts.
Examples include:
Layered on top are alerts that push only the most important exceptions to transportation teams: late shipments, dwell approaching free time, or route deviations that could affect service.
These tools keep teams focused on the small set of issues that truly require human judgment, rather than asking them to monitor every movement manually.
Leaders often sense that multimodal visibility would help, but they need a concrete case to prioritize investment.
A practical way to quantify value is to focus on a few categories:
Accessorials and penalties. Review your current annual spend on demurrage, detention, and storage. Estimate what percentage of these charges are tied to avoidable dwell or missed communication.
Service and expedites. Track the frequency and cost of customer expedites due to late or uncertain shipments. Review scorecard metrics for key customers related to on-time delivery.
Inventory and working capital. Identify safety stock driven by transportation variability and the value of inventory in transit and at critical nodes.
Labor and productivity. Calculate hours per week spent pulling status from portals, building spreadsheets, and reconciling data. Include overtime or added headcount tied to reactive work.
By connecting these costs to specific visibility gaps (mode handoffs, dwell blind spots, fragmented systems), transportation and supply chain leaders can build a business case grounded in real numbers, not just intuition.
You do not have to solve everything on day one. Many bulk shippers start with a focused initiative that addresses a known pain point while laying the groundwork for broader multimodal visibility.
Practical first steps include:
Map your current data sources. List where rail, truck, yard, and cost data lives today. Document who uses each system and for which decisions.
Prioritize by decision, not by mode. Identify the decisions that are hardest to make today (preventing demurrage, meeting customer delivery windows, or planning fleet needs). Ask what information needs to be in one place to support those decisions.
Evaluate platforms built for bulk, multimodal freight. Look for solutions that integrate rail, truck, and terminal data. Ensure they provide dashboards and analytics tuned to dwell, cycle time, and accessorial management. Confirm they can pull in order and inventory context so visibility supports real planning decisions.
With IntelliTrans, you can bring rail, truck, and terminal data together in a unified operational view, so your transportation teams can move from chasing status updates to leading change. Many organizations see early wins within months on targeted use cases such as dwell alerts, manual work reduction, or lane exception visibility, while broader transformation takes longer.
Ready to see how multimodal visibility could work for your operation? Connect with an IntelliTrans TMS expert to discuss where unified visibility would have the most impact on your network.
Basic tracking tools often show status for a single mode or carrier. Multimodal visibility connects data across rail, truck, and other modes, along with yard, order, and cost information, so teams see the full journey in one place and can manage by exception.
Not necessarily. Many shippers start by adding a visibility and analytics layer that connects to their current systems. Early wins come from unifying data and surfacing insights without disrupting core platforms.
Leading indicators include fewer manual status calls, shorter dwell times, reduced demurrage and detention, improved on-time performance, and fewer last-minute expedites. Over time, you should also see better inventory turns and stronger customer scorecard results.
When you can see shipments across modes, you can more accurately calculate emissions by lane, evaluate options such as shifting volume to rail where practical, reduce empty miles, or consolidate moves. Visibility and analytics provide the data foundation for sustainability programs that are both credible and actionable.
IntelliTrans helps bulk shippers bring rail, truck, and terminal data together in a unified operational view. With multimodal visibility, analytics, and transportation management capabilities, your transportation teams can move from chasing status updates to reducing surprises, protecting service, and planning with confidence.